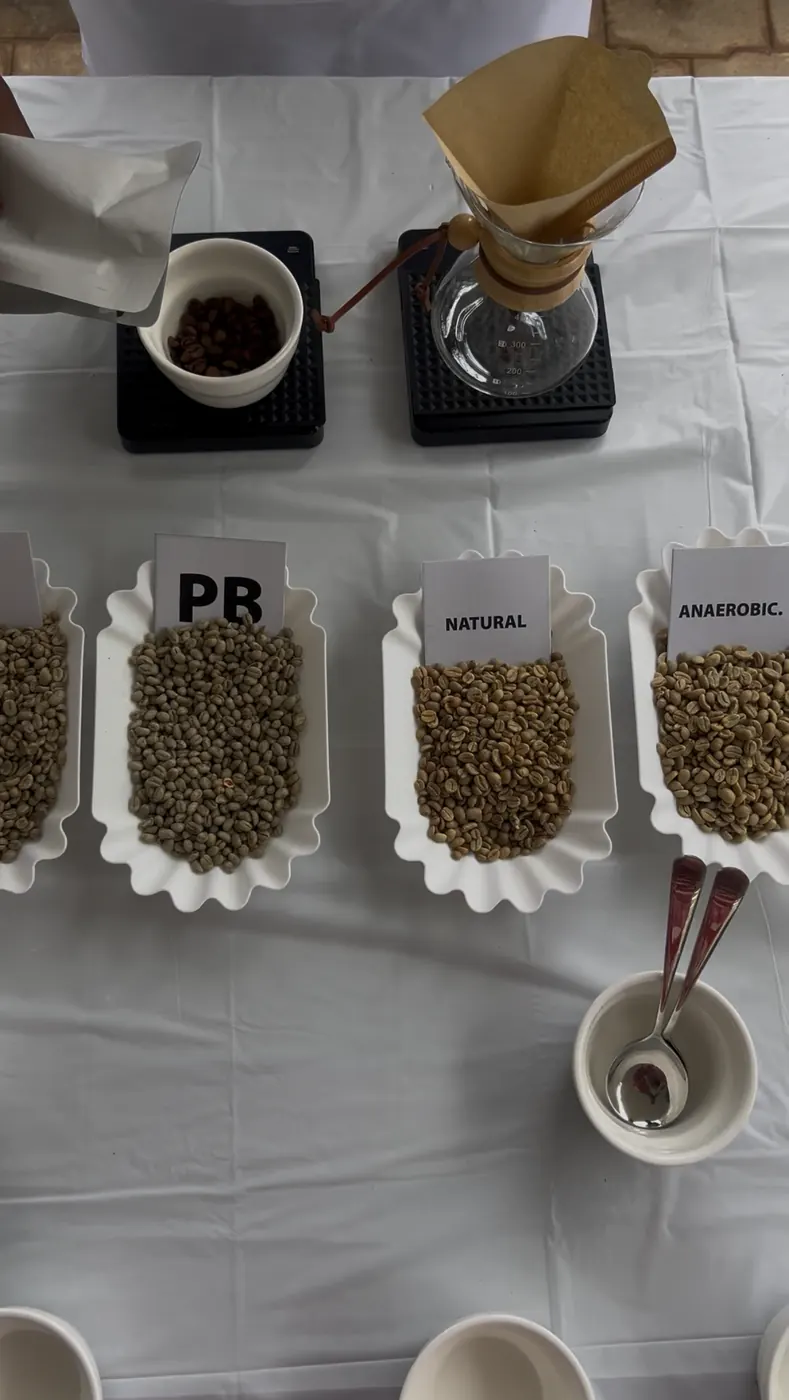
Sale 3 on 21 October 2026, as the exchange recorded it
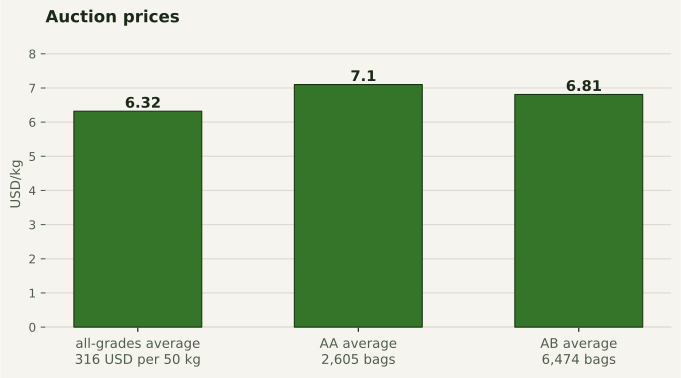
Kenyan coffee prices are set once a week, on a Tuesday, at a competitive bidding session at Wakulima House on Haile Selassie Avenue. The Nairobi Coffee Exchange lists sessions by week number on its calendar. Most begin at 8:00 or 9:00 am East Africa time. Licensed brokers sell graded lots under Capital Markets Authority oversight. Sale 3 of 21 October 2026 is the latest result in the exchange's sale reports. Its market total covered 14,926 bags, which is 917.8 tonnes, at an average of 6.32 US dollars per kilogram. That works out to 316 dollars per 50 kg bag, the way the exchange usually puts it. The whole sale was worth 5.80 million dollars.
Before the per-grade figures, three things about that line matter. Start with the unit. It is a 50 kg auction bag, not the 60 kg export bag that goes into a container at Mombasa. So a buyer comparing the auction report with a FOB offer is already comparing two bag sizes. Then the currency. Settlement is in dollars, and the shilling figures that appear in Kenyan press reports for sale 3 use the sale date's rate of 129.83 shillings to the dollar. Last, the pooling: 6.32 is an average over everything that cleared, from the largest washed beans down to the dried-whole mbuni that goes mostly to local roasters.
Timing matters too. Sessions pause between seasons, so a sale number as low as 3 in October tells you the exchange has restarted its count for a new crop year. At this point the lots on the catalogue are largely the tail of the fly crop and the first arrivals of the main crop, which is picked from October. A market in transition prices like one. A single October week is a weak base for a container budget that will be contracted from November onward.
Eight grades, eight averages, and ranges that overlap
Per-grade results for sale 3 come in the order a buyer would expect, until you read the ranges. AA averaged 7.10 dollars per kilogram across 2,605 bags, 17 percent of the sale, with lots from 3.96 to 7.72. AB averaged 6.81 across 6,474 bags, 43 percent of the sale and by far the largest grade by volume, with lots from 4.00 to 8.10. PB averaged 6.74 over 785 bags, lots from 2.56 to 7.20. C averaged 6.45 over 2,161 bags, lots from 3.42 to 6.96. Below those sit the density fractions, TT at 6.12 over 207 bags and T at 4.70 over 282 bags. Then come the mbuni: MH at 4.60 over 1,636 bags, ML at 1.66 over 223 bags.
The ends of the ranges are the tell. AB's top lot, 8.10, sold above AA's top lot, 7.72. AA's bottom lot, 3.96, sold below AB's bottom lot, 4.00. So grade as a quality tier is the wrong model. The exchange's guide to Kenyan coffee grades describes AA as the largest bean size and the one associated with premium auction prices. It describes AB as a mix of screen 16 and screen 17 beans widely used in blends. Both descriptions are about screen size. Cup score is a separate number that licensed liquorers attach to a lot. Bidding follows the cup, the factory name and the sample on the table, not the letter. A good AB routinely cups above a mediocre AA and sells for less; sale 3 shows the reverse can happen too.
PB tells the same story from the other side. Its average of 6.74 sits a touch below AB. Its floor at 2.56 is the lowest of any washed grade at sale 3, which fits the exchange's description of peaberry as a lot sold on its own as specialty or single-origin. When the cup is there, buyers pay. When it is not, nobody pays for roundness.
Do the arithmetic. AA's premium over AB at sale 3 is 0.29 dollars per kilogram on average (7.10 minus 6.81). The spread inside AA is 3.76 dollars (7.72 minus 3.96). That is thirteen times wider. Anyone pricing a container off the grade letter alone is pricing off the smaller of the two numbers. C deserves a note as well: at 6.45 it sits only 0.36 below AB (6.81 minus 6.45), narrow for a grade the exchange describes as suited to value-focused buyers. A buyer looking for blending stock should notice that gap before assuming C is the cheap end.
Twelve auctions from August to October
Across the last twelve sales, 4 August 2026 to 21 October 2026, the exchange's market-total average ran between 5.81 dollars per kilogram, recorded on 13 October, and 7.15, recorded on 11 August. The first sale in that run averaged 6.88; sale 3 averaged 6.32. So the all-grades number has fallen 0.56 dollars per kilogram from the start of August to the end of October (6.88 minus 6.32). It touched both its high and its low inside the same twelve weeks.
Over those same twelve auctions, AA ran from 6.72 to 8.08 dollars per kilogram. The median was 7.34. Sale 3's AA average of 7.10 came in under that median, and its all-grades figure was lower than the first sale of the run. On their own, those two facts say the market softened as the new crop year opened. Put them against the calendar and they say less. The weeks between the fly crop and the main crop are the year's thinnest for fresh washed lots. Bags that do show up in September and October carry more mbuni and density fractions, and those averages sit far below AA. A heavier MH share in any given week pulls the all-grades average down even when no AA lot trades at a lower bid.
Track the grade-level series. Keep the bag count next to it. An AA median of 7.34 is steadier than any one week. But that median still pools market totals: every factory and every cup score catalogued as AA across those twelve weeks. The piece on how the Nairobi Coffee Exchange auction works lays out how lots get into the catalogue under an outturn number and how the sample week comes before the sale. The price series above comes out of that process, so it inherits every lumpiness in the supply of samples.
What one average pools together
The exchange's description of Kenyan coffee grading says lots are sorted on three axes: screen size, defect count and quality. Only lots that meet the prescribed standards get accepted for sale. That sounds like a filter that makes the catalogue uniform. It does the opposite. One session carries AA, AB, PB and C from washed factory lots; TT and T, the lighter beans separated out by the density channels; and mbuni, cherry dried whole and hulled, split into MH and ML by size and quality. The exchange notes that beans which float during grading are lighter and less dense, get separated from the main grades, and typically go to blending or lower-priced lines.
No roaster filling a container would swap one category for another. An AA from a Nyeri factory and an ML from the same county are not two prices for one product. They are two products that share a Tuesday. The headline 6.32 still weights them by bags cleared. At sale 3, mbuni grades together came to 1,859 bags (1,636 MH plus 223 ML), 12 percent of the sale, at averages of 4.60 and 1.66. Washed main grades AA, AB, PB and C together came to 12,025 bags. Take out mbuni and the density fractions and the washed-grade average sits above the headline; the exchange publishes no such number, so none is given here.
Inside each grade, a second pooling happens. A Kenyan AA lot usually comes from hundreds of smallholders who deliver cherry to one cooperative wet mill, the factory. Traceability stops at the factory gate, as the post on the hands a Kenyan lot passes through from cherry to container set out. Every AA average is an average of factory outturns. Each of those is already an average of its members' deliveries.
Why 6.32 dollars is not a price anyone will quote you
An auction average is what buyers in Nairobi paid on average for coffee in 50 kg bags at the exchange on a given day. An offer price is what an exporter will sell you a named lot for in 60 kg bags, FOB Mombasa, on a stated date and inside a stated validity window. Everything between those two definitions is cost, risk or time. None of it appears in the exchange's report.
Start below the auction. KALRO figures quoted in the ICO's 2019 country profile for Kenya put the highest production cost at 52.30 shillings per kilogram and the lowest at 10 shillings, depending on variety. That spread inside one country means the reserve a factory or its marketing agent (the licensed party that sells on the grower's behalf) will accept differs lot by lot. An exporter who bought at auction carries that reserve plus the winning bid before any export cost is added. World Coffee Research's Kenya page records that by 2019 an estimated 300,000 families had replanted with Batian and Ruiru 11. So the variety mix under any pooled average is itself shifting, and the cost base with it.
Above the auction sit the exporter's steps: taking delivery against the settlement timeline the exchange prescribes for AFA-licensed buyers, re-bagging from 50 kg to 60 kg export sacks, transport to Mombasa, finance, insurance and documentation. A direct-sale lot that never passed through the auction has no auction price at all, only bilateral terms. BGI publishes no standing price for exactly this reason. A firm quote names the lot, the differential and a validity window, and says which route the lot came through. Use the auction average as a sanity check on the quote. It is not the quote.
The C market and the differential, without a table
Kenyan coffee is sold lot by lot at a differential over the New York C futures contract. On the best lots, that differential can be a multiple of the terminal price. The sources used here give no C settlement for 21 October 2026 and no published Kenyan differential, so no conversion is offered. What can be given is the method, and an explanation of why its output is still not a tradeable number.
Auction reports price in dollars per kilogram. The C contract is quoted in cents per pound. Convert the grade average to cents per pound and take the front-month settlement for the sale date. What is left is the implied differential of the pooled grade over the terminal. Do that for AA at 7.10 and for the AA median of 7.34, and you get a rough band for what the whole exchange paid above New York for the largest washed screen. Do it for the sale 3 AA range, 3.96 to 7.72, and the band is so wide it stops being a differential. It becomes a reminder that the letter is not the thing being priced.
That width is specific to Kenya. When a grade maps tightly onto a cup profile, a grade differential against the C is a workable anchor. In Kenya, the cup score, the factory and the sample drive the bid. So the differential that matters is the one on a named outturn, and only the seller of that outturn can give it. Track the C for your hedge and the AA median for your sense of the room. Price the lot off its sample.
Thin sales and the 2023 reform slump
Sale 3 cleared 14,926 bags. Compare that with the exchange when it was barely trading. The USDA Foreign Agricultural Service coffee annual for Kenya says both sale volumes and prices at the NCE slumped at the onset of Government of Kenya reforms in July 2023. Volumes hit their lowest at 3,038 50-kg bags in August 2023, after a two-month disruption of the exchange. AFA's first-quarter bulletin for 2023/24 calls the same period a substantial downturn for the auction.
A sale of 3,038 bags is roughly a fifth of sale 3 by volume. (3,038 divided by 14,926 is about 0.20.) At that scale a handful of lots decide a grade average. One large mbuni consignment, or one dealer who stays away, can move the headline in a way that has nothing to do with the cup. Averages printed for those weeks were real transactions, but they are unreadable as a signal about quality or demand. Between-crops weeks teach the same lesson every year. When the bag count is low, the average reports who showed up, not what Kenyan coffee is worth.
Regulation is still moving. The government's current framework is the Coffee Development and Marketing Strategy 2024 to 2029. Reforms of the kind that paused the exchange in 2023 can recur. For a buyer, that is a reason to insist any quote states its validity window and settlement terms. Treat a week with an unusually small catalogue as a week to watch, not to benchmark.
Nairobi roasters bid against you
Export buyers and domestic roasters bid in the same room. In the exchange's own account of the trade flow, coffee moves after purchase to export, roasting or local consumption. AFA's piece on value addition states that coffees consumed in Kenyan outlets are sourced competitively at the Nairobi Coffee Exchange just as export coffees are. There is no separate local window with a local price. A Nairobi roaster who wants a particular Kirinyaga AB outbids the importer for it, or loses it.
Domestic demand is small and growing. AFA put consumption at 1,655 tonnes green bean equivalent in 2020/21, up from 1,577 the year before. That was 4.8 percent of national production, and its 2021/22 census counted 506 coffee houses. Later AFA figures carried in the SCA's article on Kenya's domestic market show consumption rising 19 percent from 1,722 tonnes in 2021/22 to 2,051 in 2022/23, against national production of 48,648 tonnes. With 95 percent of the crop exported, those are production and consumption shares, not auction data, and they say nothing about any week's bids. Local demand is the natural buyer of C, which the exchange describes as suited to regional markets, and of the mbuni that made up 1,859 bags at sale 3. A domestic market growing by a fifth in a year adds bids at the bottom of the catalogue first.
Reading secondary sources on Kenyan pricing
Plenty of what circulates about Kenyan coffee prices is secondhand, and some of it is wrong in ways that matter. There is a European Commission study from 2013 on marketing Kenyan coffee as a geographical indication that says Kenyan prices are mainly set at the Nairobi Stock Exchange, and that this was the only authorised market before liberalisation. That is not right. Prices are set at the Nairobi Coffee Exchange, at Wakulima House. The stock exchange is a different institution. When a report mislabels the market, look twice at its price figures before they go into a model.
Old explanations of price swings need the same caution. AFA's value-addition piece pushes back on the popular claim that a Kenyan price boom came from a Brazilian shortfall. Brazilian output actually rose to about 65 million 60-kg bags in 2019, up from 49 million in 2018. The piece names the 1989 collapse of the International Coffee Agreement quota system, oversupply and high-yielding varieties as the structural drivers of the long-run decline.
So here is a short rule for buyers. Get price figures from the exchange's own sale reports, and attach the sale number and date. Get grade definitions from the exchange and AFA, not from bag copy. For regional context, use a source that names counties, such as the overview of where Kenyan coffee grows. And a figure that turns up without a unit, a date and a bag count is a rumour until it has all three.