The Kenyan coffee harvest season is two seasons, and the exchange that sells the coffee runs on a third calendar of its own. A buyer planning a container needs all three in one view: when cherry is picked, when a milled lot is catalogued and sold in Nairobi, and when a sale turns into a bill of lading at Mombasa. Dates follow for the parts that have dates. Where no published source gives one, the gap is named instead.
The main crop: picked October to December, contracted from November
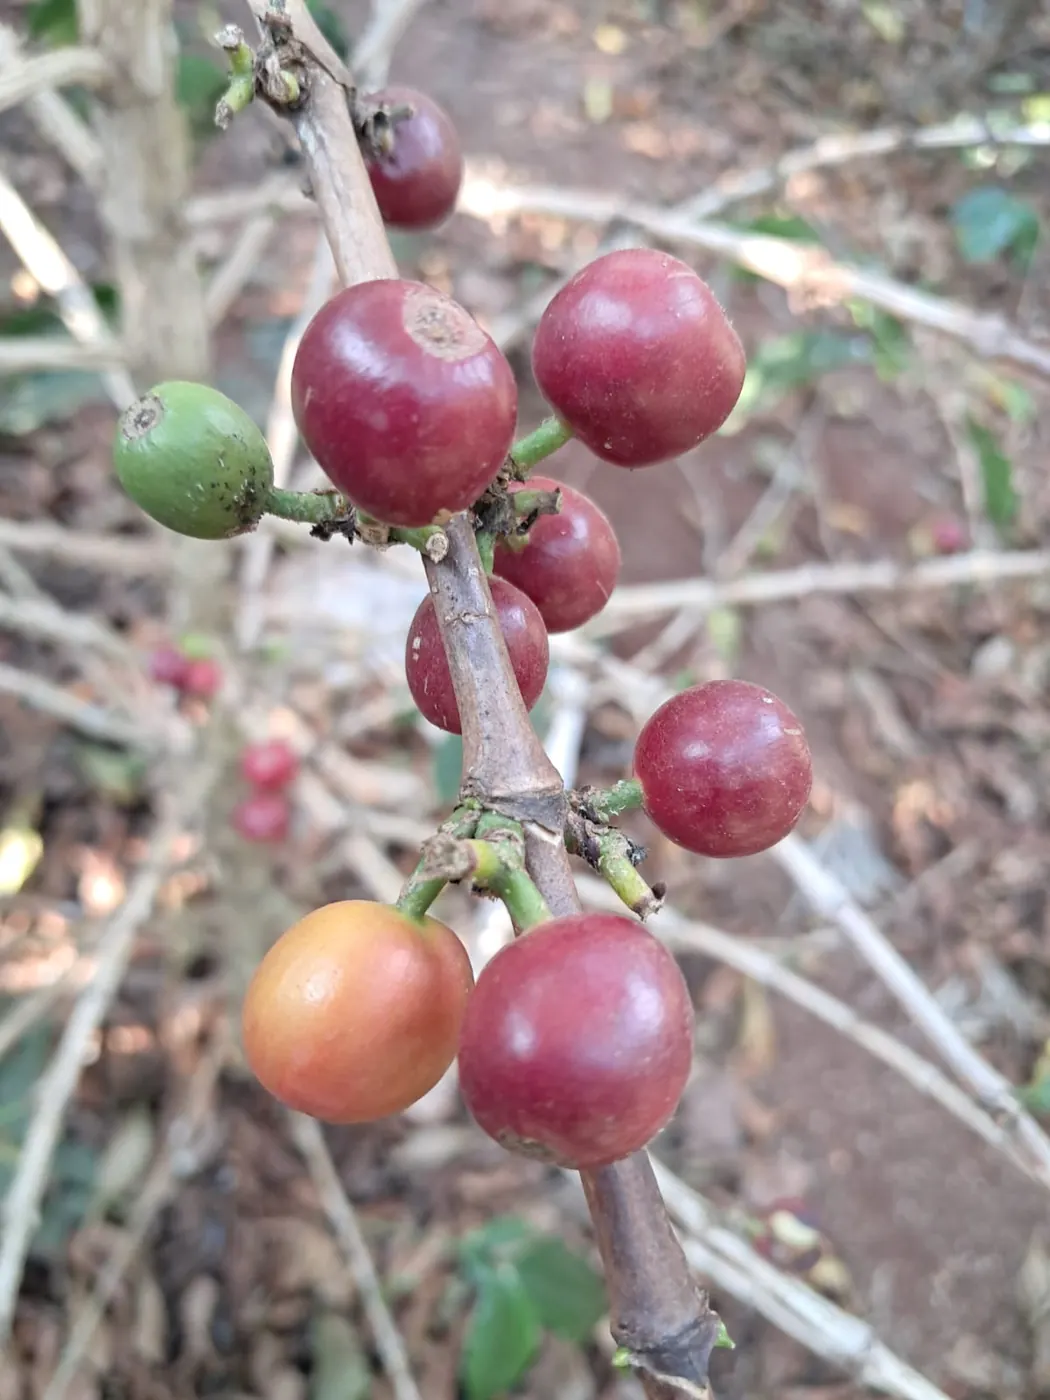
Kenya's main crop comes off from October through December, and in some areas it runs into January. Most of that coffee comes from counties a buyer already sees on catalogues. The Agriculture and Food Authority's review of the coffee sub-sector names Kiambu, Kirinyaga, Nyeri, Murang'a, Kericho and Bungoma as the leading producers among 33 coffee-growing counties. From that list, the central highland group described under where Kenyan coffee grows sits on red volcanic soil at roughly 1,300 to 1,900 metres. Its main crop is what most importers mean when they say Kenya.
Pickers work selectively and by hand. A smallholder brings cherry to the cooperative wet mill, which in Kenya is called a factory, on the day it is picked. The sequence starts with hand sorting. Pulping happens that evening, fermentation overnight, then either a second fermentation or a long soak in clean water. The coffee is graded by density in water channels and spends one to two weeks on raised drying beds. Cherry picked in late October is still parchment on a bed in November.
So "picked October to December" and "ready to contract from November" are both true. Neither one is enough on its own. The first main crop lots become contractable from November, but picking runs two months behind the first offers. January deliveries in the later areas push the tail into the new calendar year. A buyer who wants a named factory's main crop is choosing a window, not a date. One wet mill takes cherry from hundreds of farms across the whole picking period. An AA lot is the pooled output of those farms. That is why traceability in Kenya is stated to the factory and never to a farm or a picking day. It is also why asking an exporter "which weeks did this outturn's cherry come in" is a fair question with a real answer, while asking for a farm is not.
The fly crop is smaller, lighter, and sells in the middle of the year
The fly crop comes off the same trees from roughly April to June. It is smaller than the main crop and lighter in body. That is about as far as a general statement can go without inventing figures. No source used here splits Kenyan production between the two crops. AFA reports one annual number: 48,648 MT in FY 2022/23. Cooperative societies produced 34,488 MT of that, and estates produced 14,160 MT. A buyer who wants the split between main and fly has to get it from the exporter, lot by lot.
For an importer, the fly crop bridges the gap between main crops. A roaster who contracted in November and received coffee in the new year faces a long stretch before the next main crop reaches the catalogues. Fly crop lands in the middle of that stretch. Whether it is the right fill depends on the job the Kenyan component does. A lighter-bodied washed lot behaves differently in a blend from a dense main crop AA. A roaster selling Kenya as a single origin on body and blackcurrant acidity may prefer to carry more main crop and skip the fly crop entirely. Neither choice is wrong. Deciding it in October, when main crop can still be bought in volume, costs less than deciding it in May with fewer options.
Varieties do not change from one crop to the other. The World Coffee Research entry for SL28 records that it was selected in 1935 from a single tree at the Scott Agricultural Laboratories. It also notes trees of 60 to 80 years still productive across Kenya. SL28 and SL34 remain the backbone. Ruiru 11 and Batian are planted for berry disease and rust resistance. One entry in the same catalogue describes a variety adapted to rainy zones because of a late harvest in the dry season. The visible text does not name which variety, so no Kenyan fly crop timing should be hung on it. Rainfall and altitude set picking windows here, not which tree stands in the row.
From parchment to outturn number
The dry mill sits between the drying bed and the auction catalogue, and this stretch of the harvest calendar has the fewest published numbers. Parchment leaves the factory for a licensed dry mill. There it is hulled and sorted by screen into E, AA, AB, PB, C, TT and T. It is catalogued under an outturn number that stays with the coffee through sale and shipment. How the Nairobi Coffee Exchange auction works covered what happens next. Samples go to the licensed trade before the sale, and the lot is cupped in the week before it sells. None of the sources used here give a turnaround from factory delivery to catalogue, and no figure is offered for one. A milled lot appears some weeks after the cherry was picked. The gap moves with the mill and with how heavy the season is.
The queue comes down to scale. New KPCU's account of the Kenyan coffee sector puts the sector at roughly 4,000 estates and more than 800,000 smallholder producers, processing through about 550 cooperative societies. Cooperatives hold 75 percent of the acreage but produce less than half the total output. Now set that beside AFA's numbers: about 70 percent of production from smallholders under cooperatives and 30 percent from estates. The Nairobi Coffee Exchange counts over 700,000 small-scale farmers. The definitions plainly do not line up. One source counts producers, another counts share of output, a third counts acreage. Any per-farmer yield a buyer works out from these will be off by the width of the definition. AFA does give the range that matters more for planning volume: 2 to 15 kg per bush, and an average farmer age of 60. A factory's tonnage in a season is the sum of many small, variable deliveries. The catalogue shows that in lot size and in timing.
How the auction week numbers run through the year
Sessions carry calendar-week numbers, and for a buyer trying to place a lot in time, the published Nairobi Coffee Exchange auction calendar is the only timetable that matters. Every listed session happens at Wakulima House on Haile Selassie Avenue in Nairobi, in East Africa Time. The run starts with Week 42 on a Wednesday at 8:30 am, then Week 44 on a Tuesday at 8:00 am. Weeks 46 through 50 fall on Tuesdays at 9:00 am, and Weeks 1 through 19 of the following year also on Tuesdays at 9:00 am. One entry, Week 13, is printed as a Tuesday at 9:00 pm while every other Tuesday reads 9:00 am. Treat that as a typo and confirm it; do not plan for an evening session.
Two things stand out. Week numbering crosses the calendar year without a reset, and that is useful. The sale that handles the first main crop lots and the sale that handles the last of them belong to the same numbered run, even though one falls in December and the other in the new year. Second, the calendar's month filter runs January to December. Sessions are scheduled through the whole year rather than in one seasonal block, even though the exchange's own sale reports note that the auction pauses between seasons. A calendar lists sessions. It does not promise volume in every one of them.
Tuesday is an old habit. The exchange's International Coffee Day note on its own history dates the first Kenyan auction to September 1935. After independence in 1963, the industry was organised around a weekly government-run open auction. Weekly is the design. Gaps in the published list, with Weeks 43 and 45 absent from the start of the run, are the detail a buyer should notice before promising a roaster a sale date.
Sale 42 of September 2026 as a picture of the between-crops market
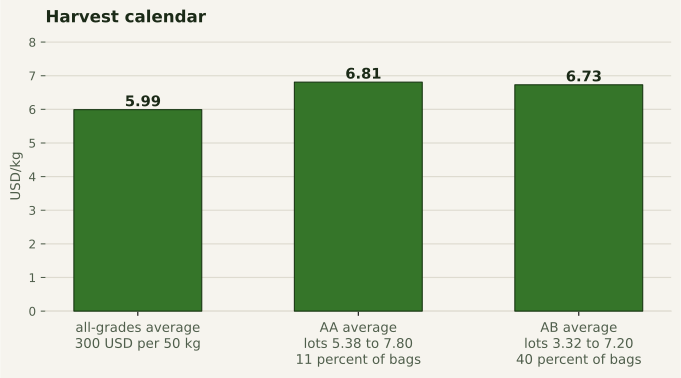
Exchange results give the best evidence of what the between-crops period looks like, as long as you read them as market totals and nothing more. Sale 42 at the Nairobi Coffee Exchange on 29 September 2026 covered 14,930 bags, 927.2 tonnes, at a market-total average of 5.99 dollars per kilogram. The exchange also states that as 300 dollars per 50 kg, for 5.56 million dollars across the sale. Across the twelve sales from 14 July to 29 September 2026, the market-total average ran from 7.63 dollars at the first down to 5.88 on 22 September, and 5.99 at the last. AA across those twelve ranged from 6.81 to 8.32 with a median of 7.69. Sale 42's AA average of 6.81 sat at the bottom of that range.
Those are the exchange's figures for the whole market, in dollars per kilogram, settled in dollars, with shilling equivalents at the sale date's rate of 129.67. They are not a FOB price, not an offer, and not any exporter's purchase. A late September sale sits after the fly crop has been milled and before main crop reaches the catalogues. The drift in the averages across that run is consistent with thinner, lighter coffee meeting steady demand. Consistent with, not proof of: twelve sales cannot separate crop quality from the New York terminal, which Kenyan coffee trades above as a differential, and no source here gives the C price for those dates.
Grade mix at sale 42 is the more durable lesson. AB was 5,909 bags, 40 percent of the sale; AA was 1,681 bags at 11 percent; C was 2,821 bags at 19 percent. The headline grade is a small slice of what is offered on any given Tuesday in the shoulder months and, on those volume shares, probably in the peak ones too.
Two clocks: calendar weeks on the exchange, July to June at AFA
Calendar weeks cross the new year without a break on the exchange. AFA counts in a fiscal year that runs July to June, and every national statistic a buyer is likely to quote comes in that frame: production, auction volume, direct sales, exports. A main crop picked in October to December 2022 and sold through the following months therefore sits in AFA's FY 2022/23. So does the fly crop picked in April to June 2023. One fiscal year holds one main crop and the fly crop that follows it. Mapping a lot to the statistics means asking which fiscal year the sale fell in, not which year the cherry was picked.
Against that backdrop, the NCE's description of itself as the central marketplace for the marketing, trading, pricing and settlement of Kenya's coffee holds up when you look at the volumes. AFA reports that nearly 80 percent of Kenyan coffee goes through the auction, with the remaining 20 percent sold directly to buyers. In FY 2022/23, the auction moved 32,652 MT and direct sales added 9,350 MT, for a combined 42,001 MT valued at 176.43 million dollars. Production that year was 48,648 MT. Sales ran below production. Some coffee was carried, some sold in a different window, and the two series are not built to reconcile exactly. Green coffee exports in the same year were 46,428.78 MT worth 241.53 million dollars, a third figure that matches neither of the others.
This is not a mistake. It is three events, sale, production and shipment, counted in one fiscal window that two harvests pass through at different speeds. For a container buyer, the practical point is that a direct-sale lot and an auction lot from the same factory and the same picking week can land in the same fiscal year with different dates on the contract. On the auction side, the exchange runs a Direct Settlement System. The direct window settles on whatever bilateral terms are agreed. Ask which route a lot came through. That answer changes what the outturn number tells you about timing.
Regulation moved the 2022/23 numbers more than the weather did
The clearest warning in the national data sits in FY 2021/22 to FY 2022/23, and it is not a weather story. Auction volume fell 15.8 percent, from 38,790 MT to 32,652 MT, and AFA attributes that drop to changes in the regulations during the period. Direct sales fell 21 percent, from 11,841 MT to 9,350 MT. Combined sales fell 17 percent in volume, from 50,631 MT to 42,001 MT, while dollar value fell much further, from 311.88 million to 176.43 million. Production fell too, from 51,852 MT to 48,648 MT, and yields fell from 0.47 to 0.44 MT per hectare, which AFA puts down to harsh weather accelerating coffee berry disease in the central region. But the production fall is smaller than the sales fall. Rules moved more coffee than rain did.
The rules at issue were the Capital Markets Authority (Coffee Exchange) Regulations 2020. They provide for licensing of brokers and are credited with enabling farmer institutions to reach the auction directly. A reform that widens access can still thin a year's auction while licences are issued and participants adjust. The harvest calendar cannot teach this on its own: Kenyan supply reaches the market through an exchange overseen by the Capital Markets Authority, and a change of rules can disrupt the sequence of sales as effectively as a failed flowering. A main crop can be picked on time. It can still arrive late in the catalogues.
The forward view is better. The USDA Foreign Agricultural Service's Nairobi coffee annual forecasts production in marketing year 2025/26 up 13.3 percent to 850,000 bags, driven by improved farm practices as growers respond to the high prices of MY 2024/25. Keep in mind a third unit system: FAS counts in bags and marketing years, AFA in metric tonnes and fiscal years, and the exchange in bags and week numbers. Area under coffee rose 2.29 percent to 111,902 hectares in FY 2022/23, with Nandi County adding the most at 404 hectares, so the leading-county list is not the whole map.
Where the value sits by grade, and what that does to the buying window
In Kenya, grade is a sieve size, never a cup score, as Kenyan coffee grades explained set out screen by screen. For a buyer working the harvest calendar, though, the grade schedule is a pricing instrument. It shows where competition will concentrate before any sample arrives. AFA's value split for FY 2022/23 is blunt. Main grades AA, AB, C, E, PB, T and TT carried 89.6 percent of the value of coffee sold, miscellaneous grades HE, SB, UG, UG1, UG2 and UG3 carried 4 percent, and unwashed grades MH, ML, NH, NL, RH and RL carried 6.4 percent. Main-grade purchases that year came to 27,682.68 MT worth 114,524,670.94 dollars, down 19 percent in volume from 33,975.73 MT worth 210,425,903.30 dollars the year before.
Set that beside the grade mix at sale 42. AB, usually the largest grade by volume, averaged 6.73 dollars per kilogram against AA's 6.81, a gap of 8 cents on the averages. PB at the same sale ran from 3.84 to 9.60, the widest range of any main grade, with its top above the top AA lot at 7.80. Averages sit close. Ranges do not. The calendar adds timing. AA is a small share of every sale, 1,681 bags against 5,909 of AB at sale 42, roughly three and a half times as many AB bags. A buyer who needs screen 17 and above from a named factory competes in a narrow window when that factory's main crop outturns are catalogued. A buyer who can work with AB has more bags at most sales and more weeks in which to choose.
The other calendar signal is Mbuni. MH and ML are whole cherry dried rather than washed, and at sale 42 MH averaged 4.58 and ML 2.24 dollars per kilogram. How much of a sale they make up says something about how much cherry did not go through the washing line. Rough and imperfect, yes, but a buyer reading a shoulder-month catalogue has few other gauges.
Shipping from Mombasa: count from the sale, never from the pick
A sale in Nairobi turns into a container at Mombasa, and transit is the last clock that runs. Green coffee leaves East Africa in 60 kg bags, FOB Mombasa. A 20 ft container holds 300 to 320 bags, which is 18.0 to 19.2 tonnes, while a 40 ft box is weight-limited to about 440 bags or 26.5 tonnes, so it never carries double a 20 ft load. Sea time to Northern Europe runs roughly four to six weeks, and you count it from the sale and the export documents, never from the picking month. On that transit, a lot bought in a late-year sale is a new-year arrival in Germany or Belgium, and fly crop bought mid-year arrives in late summer.
The export table tells you who else is on that route. Kenya shipped to 52 destinations in FY 2022/23, and three buyers took a large share: the USA 11,228 MT worth 59.20 million dollars, Germany 8,347 MT worth 39.34 million, Belgium 5,026 MT worth 29.12 million. Total exports rose by 5,099 MT, from 42,858 MT to 47,957 MT, while dollar value fell from 298.56 million to 252.12 million, which AFA attributes to exchange rate variation. For a dollar buyer, that is the gap between a crop story and a currency story: more coffee left the country and it fetched fewer dollars. Domestic consumption is small but growing against the same crop, up 19 percent to 2,051 MT.
An importer builds the arrival plan backwards. Pick the roasting month, subtract four to six weeks of sea time and the time the exporter needs after the sale for milling release and export processing, which no source here quantifies, and you have the latest sale week to buy in. For main crop that lands on the Tuesday run from Week 46 into the new year. For fly crop it lands in the mid-year sessions. The World Coffee Research country page for Kenya puts the smallholder base at 800,000 farmers, and how fast they pick, factory by factory, sets the front end of this chain. Nothing a buyer does moves it. What is left to the buyer is which sale week to bid in and which box to book.